
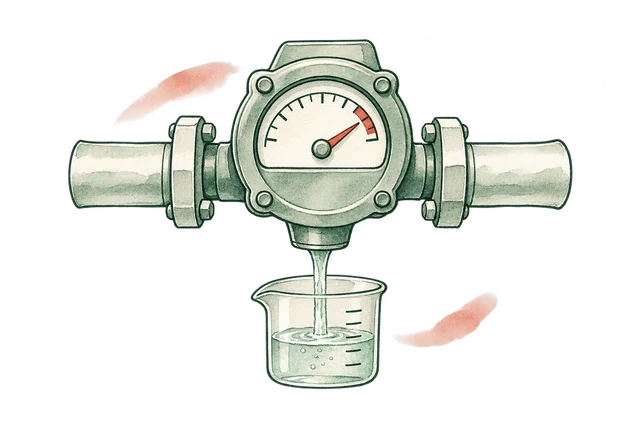
Overview
We designed the monitoring workspace around a reading history and an exception record.
View the screen ↓
We designed the monitoring workspace around a reading history and an exception record.
The chart makes a change visible, while the original observation remains available for inspection.
A flagged water-use reading needs its calculation, period and review context. The chart should lead to the evidence rather than imply that a threshold explains the cause.
The reviewer action and period report give the flag a next step without turning it into a diagnosis. We also kept the method accessible so the display's basis can be examined. The publication-style chart is an entry into the evidence, not a substitute for it.
The build brings overview, reading history, exception, reviewer action, period report and method into one workspace.
We designed the monitoring workspace around a reading history and an exception record.
View the screen ↓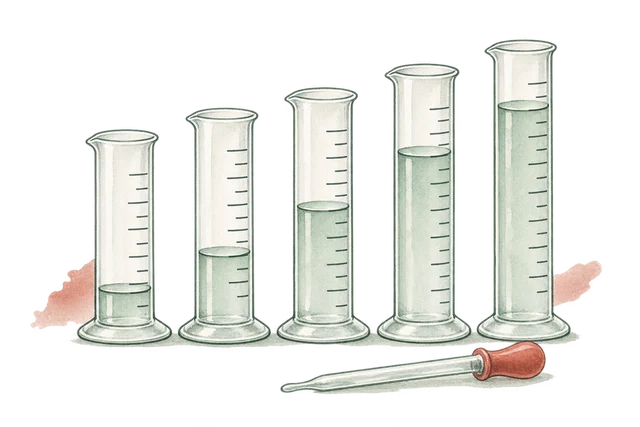
Keeps previous readings visible so the current exception can be reviewed in context.
View the screen ↓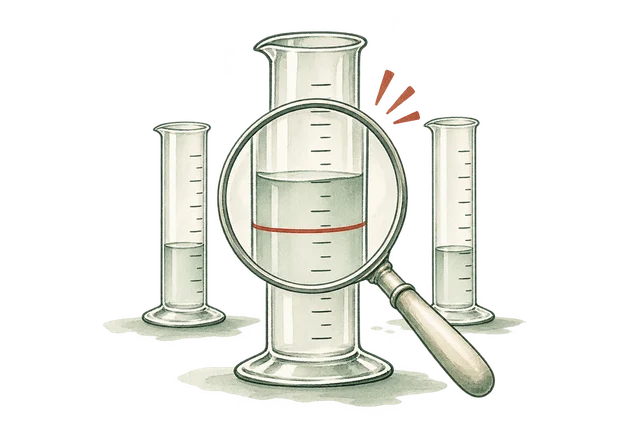
Connects the flagged reading to its threshold, supporting record and review status.
View the screen ↓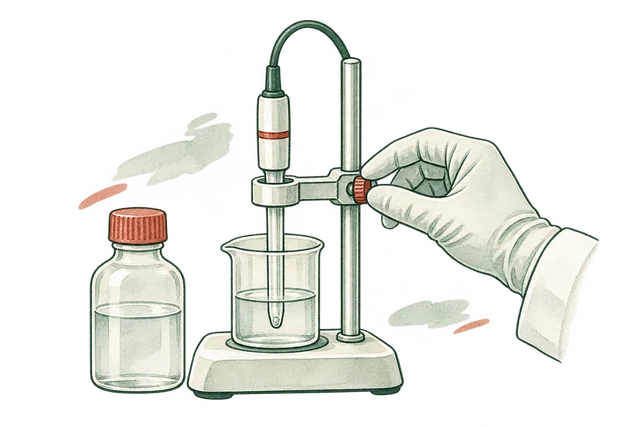
Link the reviewed context, state any uncertainty and preserve the original daily volume.
View the screen ↓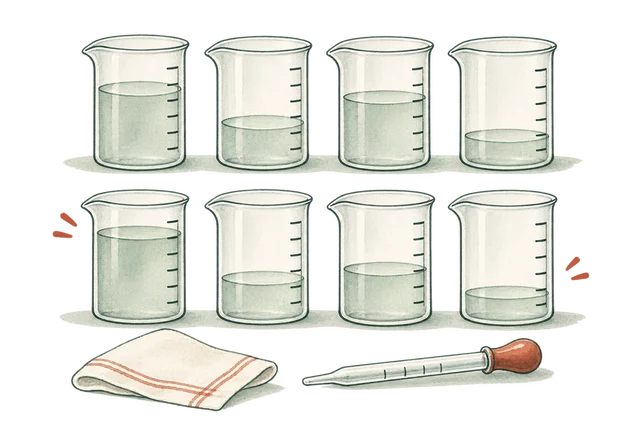
Previous-week values are aligned by day position for comparison, not shown as readings from the current dates. The aggregate difference alone does not establish an operational cause.
View the screen ↓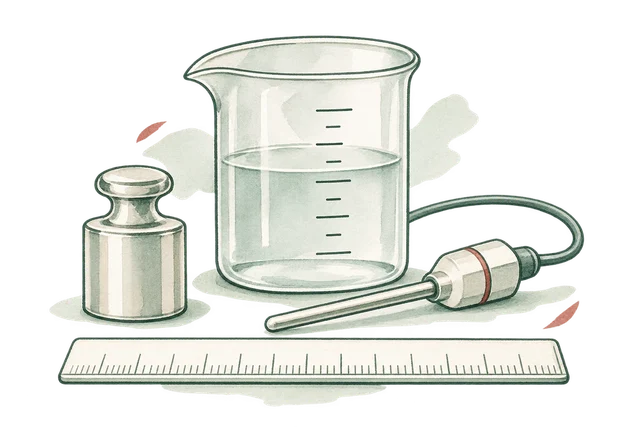
Explains the daily totals, comparison period and threshold used to flag readings for review.
View the screen ↓Explore the interface, from the first impression to the finer details.
Choose a view to enlarge ↓Tell us what your customers or team need to do. We can help define the pages, records and interactions around that task.


