Energy & Utilities
Utility Operations Dashboard
Water supply, distribution and quality, managed before the pressure drops.
About this project
This water utility's operations teams were monitoring supply, distribution and quality data from isolated SCADA and sensor systems, which made it hard to catch emerging distribution issues or quality exceedances before they needed an emergency response. We designed an Operations Dashboard that maps live water production against demand, breaks distribution performance down by zone, shows quality monitoring data next to regulatory thresholds, and puts outage alerts front of screen. Zone status panels give network engineers a geographic picture without leaving the dashboard. The Water Supply, Distribution, Quality Monitoring, Outages and Reports modules support both shift-level decisions and management reporting.
What we delivered
- Product Strategy
- UX Research
- Data Visualisation Design
- Design System
- Frontend Engineering
- Real-Time Data Integration
- Accessibility (WCAG 2.2)
More work
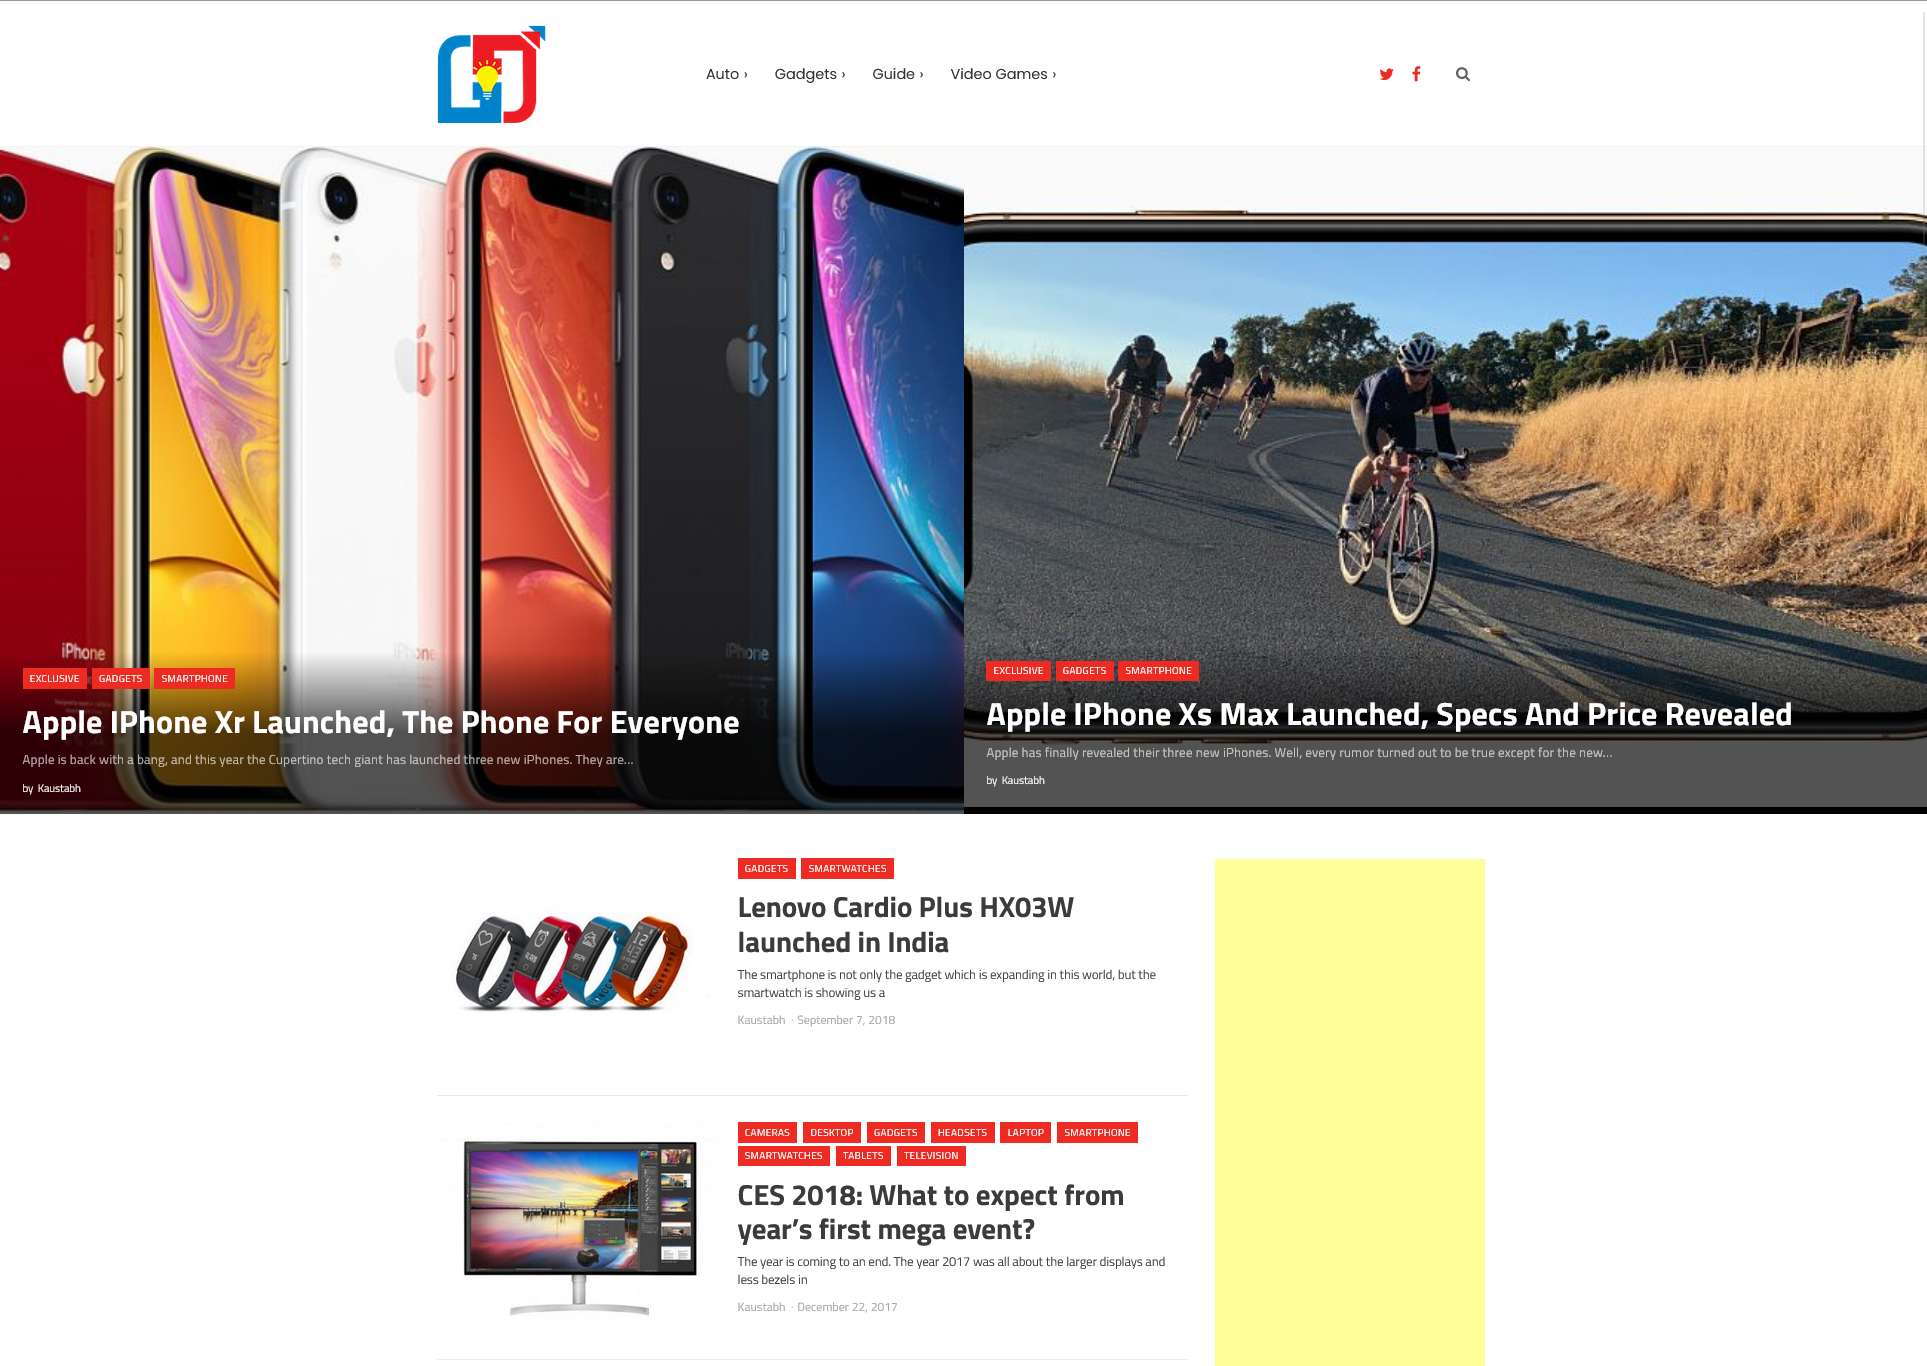 Media / Publishing
Tech Blog website
A modern technology blog built on WordPress.
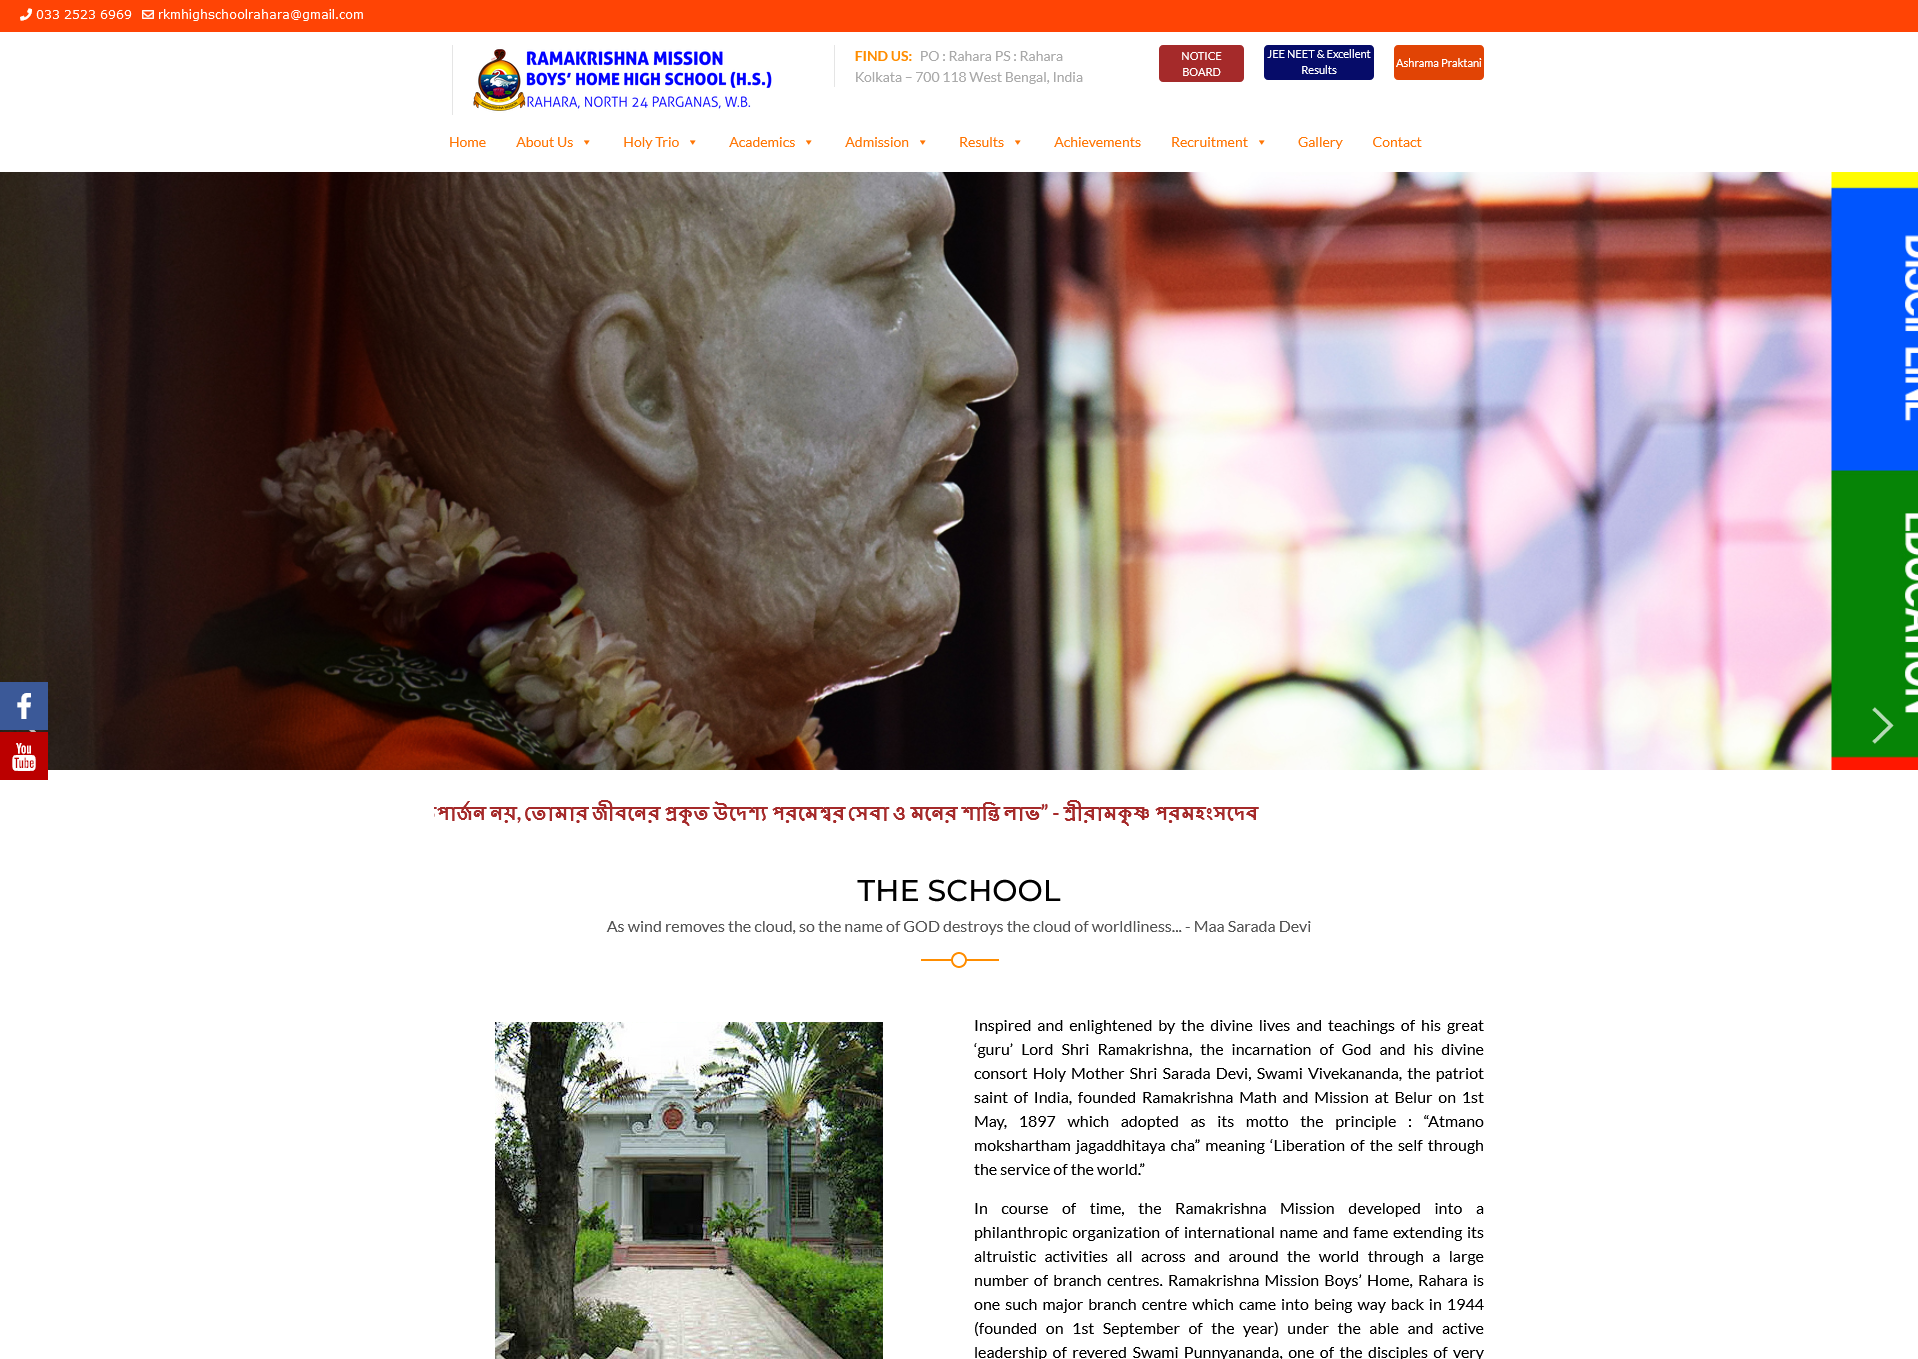 Education
School Website
A clean, informative school website built on WordPress.
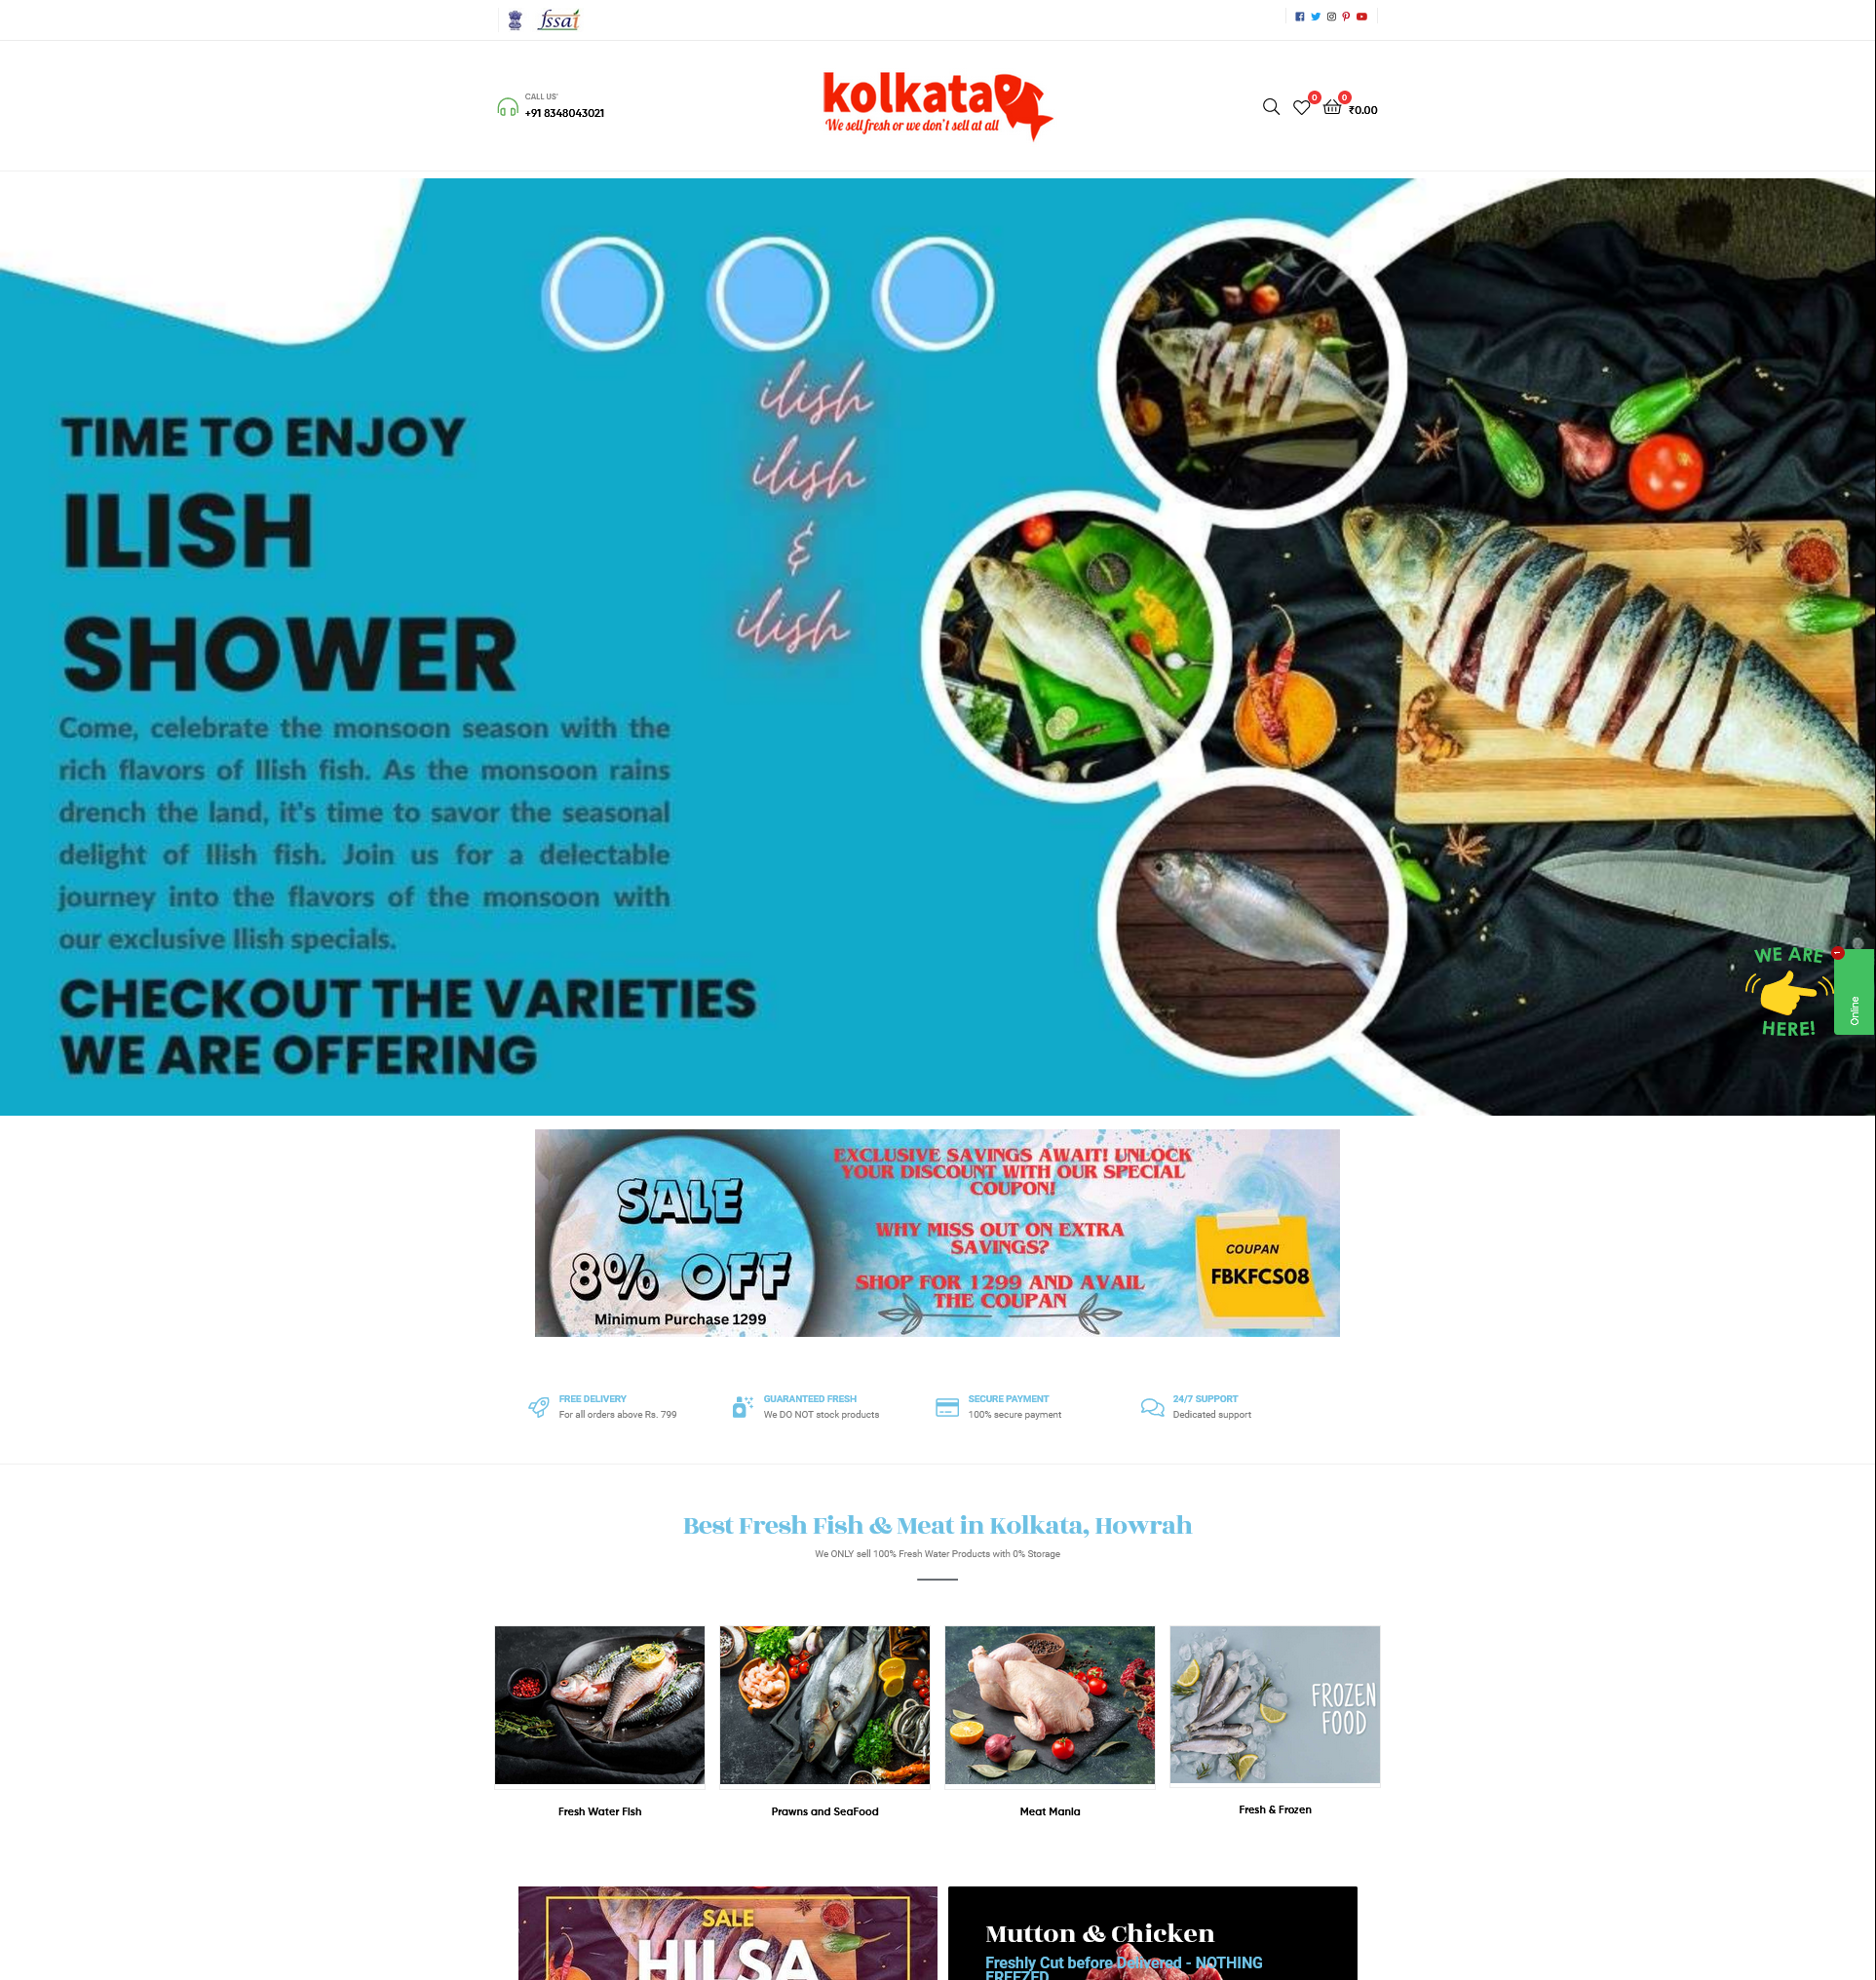 E-commerce / Food
Fresh Fish e-commerce website
A WooCommerce store for fresh fish and meat with custom delivery-slot plugins.
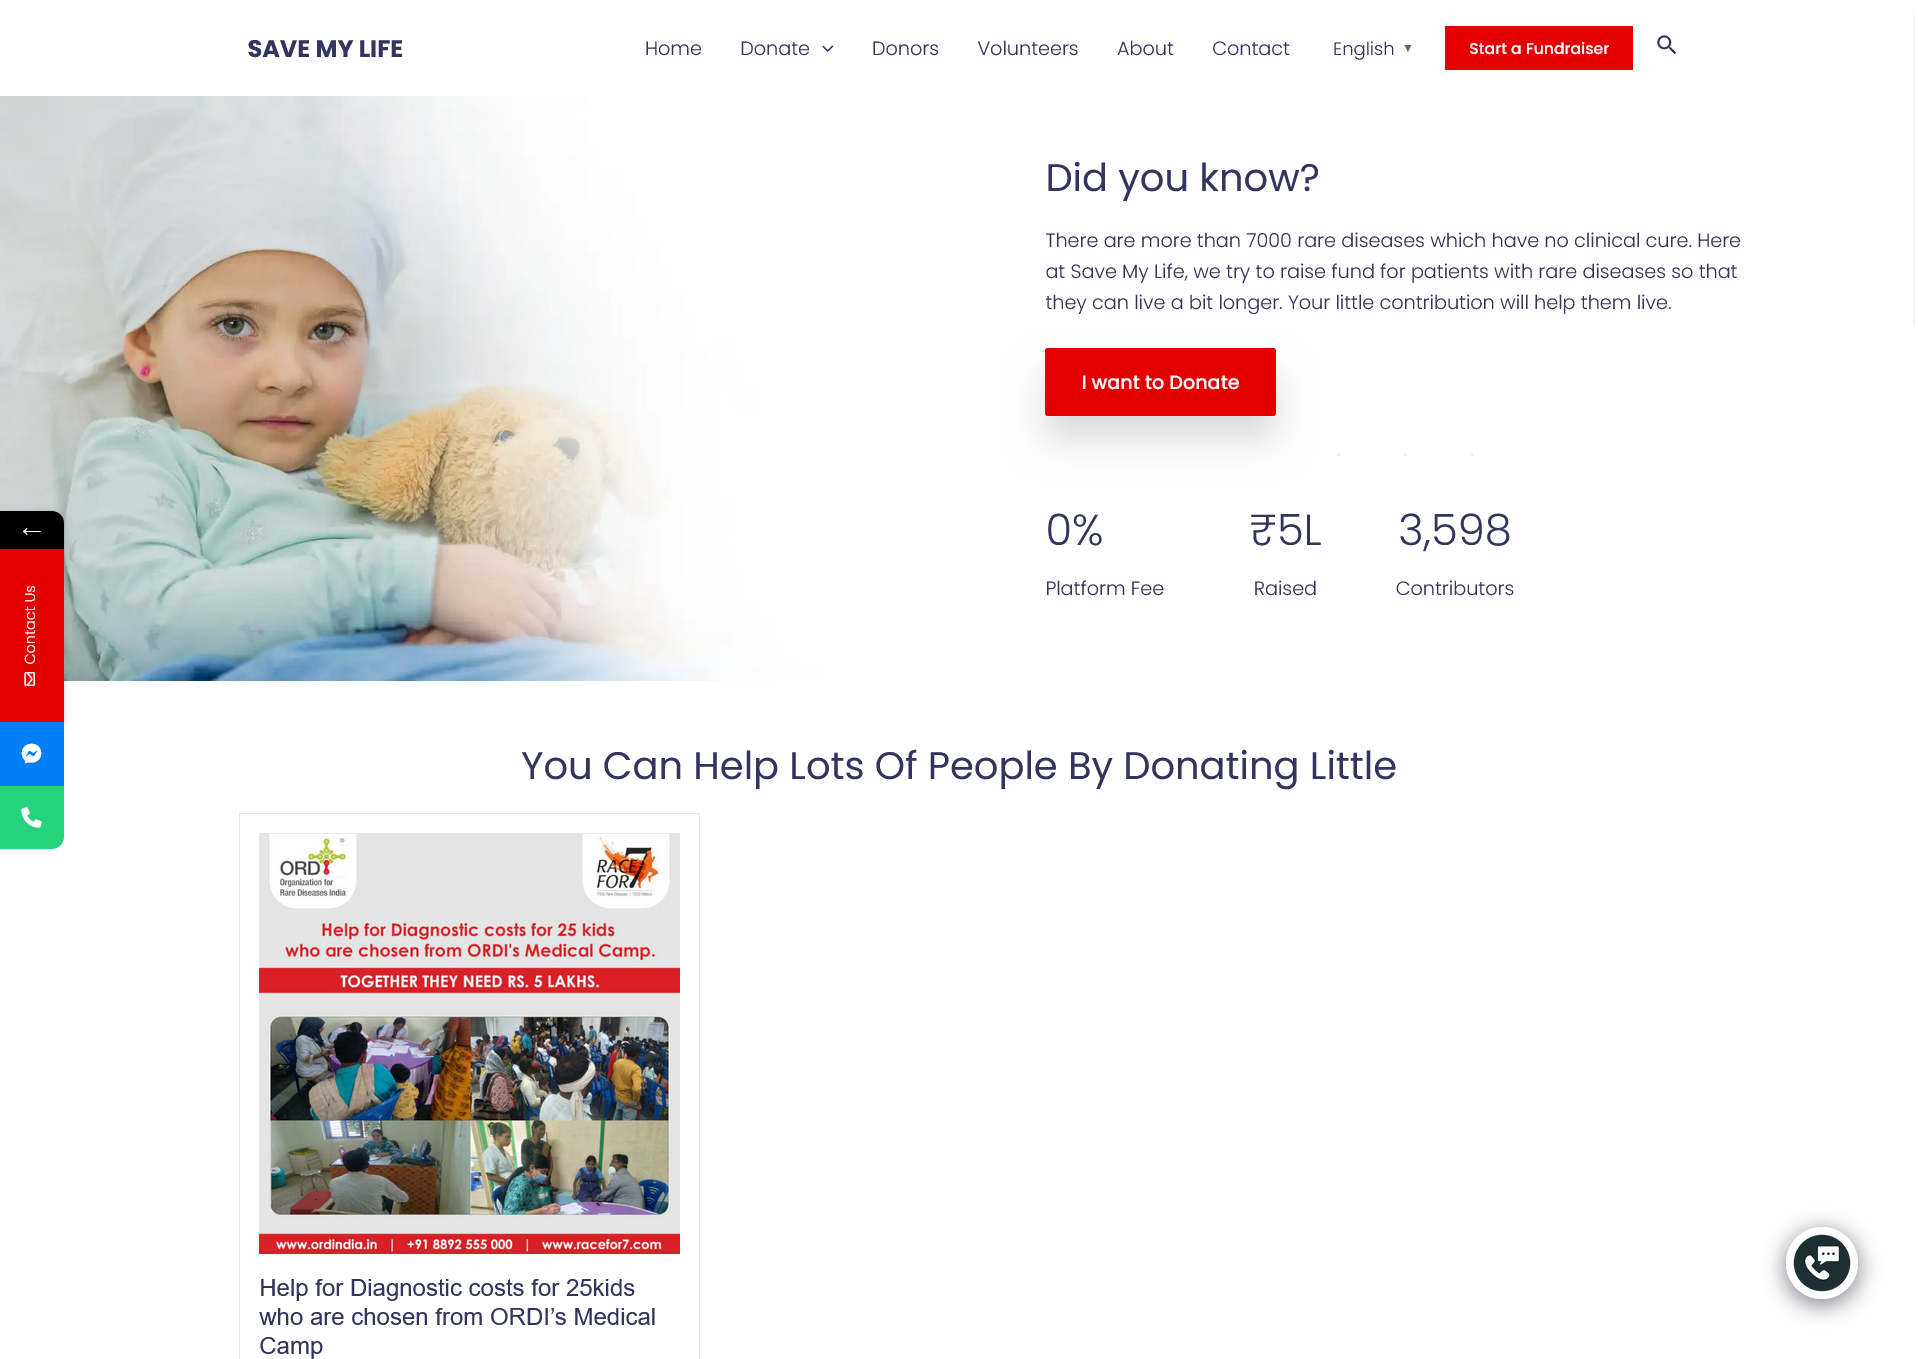 Healthcare / Non-profit
Crowdfunding Platform
A WordPress crowdfunding platform with custom plugins to support financially weak patients.
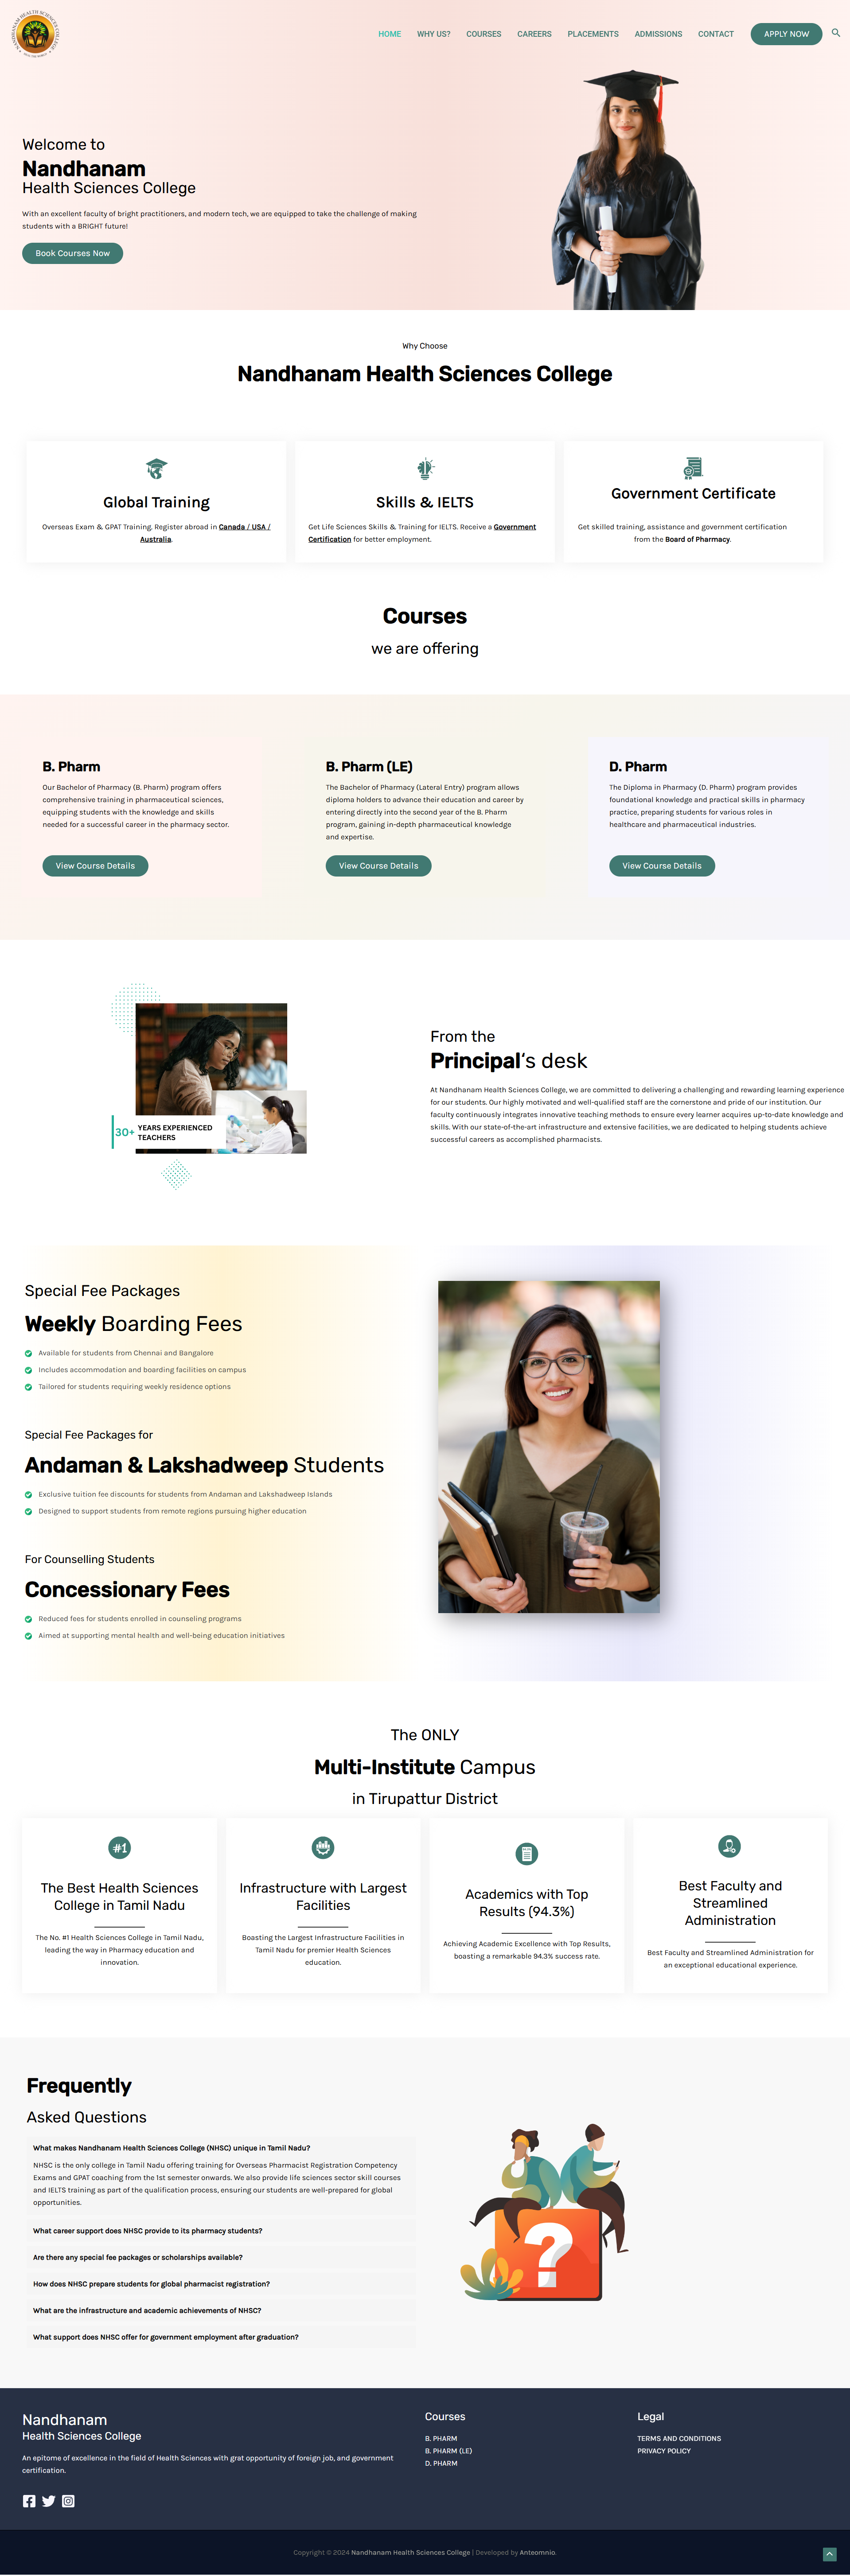 Education
Health Sciences College Website
Custom WordPress website design for a health sciences college, built on the Astra framework.
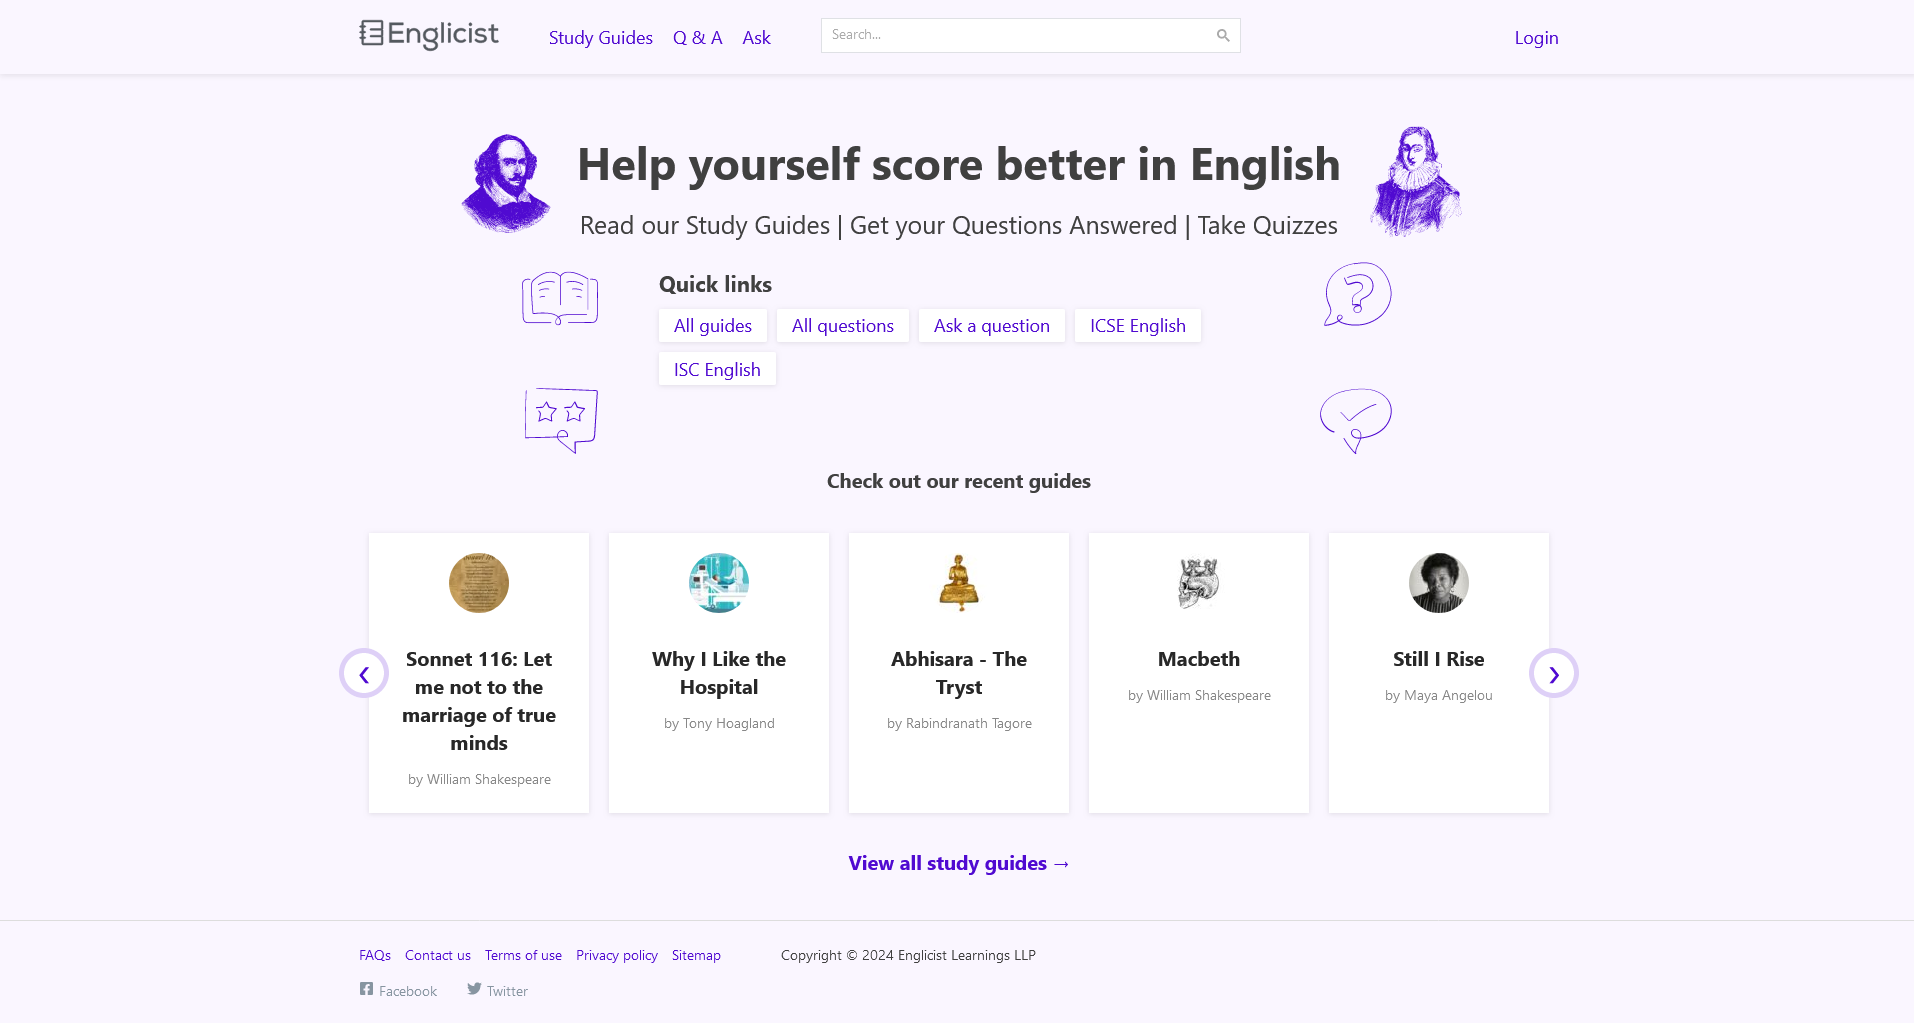 Education / E-learning
LMS Platform
A WordPress Learning Management System with role-based memberships and payment gateway.